
Simulating Fake Data in R
This blog post is on simulating fake data. I'm interested in creating synthetic versions of real datasets. For example if the data is too sensitive to be shared, or we only have summary statistics available (for example tables from a published research paper).
If we want to mimic an existing dataset, it is desirable to
- Make sure that the simulated variables have the proper data type and comparable distribution of values and
- correlations between the variables in the real dataset are taken into account.
In addition, it would be nice if such functionality is available in a standard R package. After reviewing several R packages that can simulate data, I picked the simstudy package as most promising to explore in more detail. simstudy is created by Keith Goldfeld from New York University.
In this blog post, I explain how simstudy is able to generate correlated variables, having either continuous or binary values. Along the way, we learn about fancy statistical slang such as copula's and tetrachoric correlations. It turns out there is a close connection with psychometrics, which we'll briefly discuss.
Let's start with correlated continuous variables.
# Loading required packages
library(simstudy)
library(data.table)
library(ggplot2)
Copulas: Simulating continuous correlated variables
Copulas are a fancy word for correlated ("coupled") variables that each have a uniform distribution between 0 and 1.
Using copulas, we can convert correlated multivariate normal data to data from any known continuous probability distribution, while keeping exactly the same correlation matrix. The normal data is something we can easily simulate, and by choosing appropriate probability distributions, we can approximate the variables in real datasets.
Ok let's do it!
Step 1: correlated multivariate normal data
The workhorse for our simulated data is a function to simulate multivariate normal data. We'll use the MASS package function mvrnorm(). Other slightly faster (factor 3-4) implementations exist, see e.g. mvnfast.
The trick is to first generate multivariate normal data with the required correlation structure, with mean 0 and standard deviation 1. This gives us correlated data, where each variable is marginally (by itself) normal distributed.
Here I simulate two variables, but the same procedure holds for N variables. The Pearson correlation is set at 0.7.
set.seed(123)

corr <- 0.7

cov.mat <- matrix(c(1, corr,
                  corr, 1), nrow = 2)

df <- data.frame(MASS::mvrnorm(n = 1e4,
                               mu = c(0, 0),
                               Sigma = cov.mat))
(The diagonal of 1 makes sure the variables have SD of 1. The off diagonal value of 0.7 gives us a Pearson correlation of 0.7)
Did it work?
ggplot(df, aes(x = X1, y = X2)) +
  geom_point(alpha = 0.3)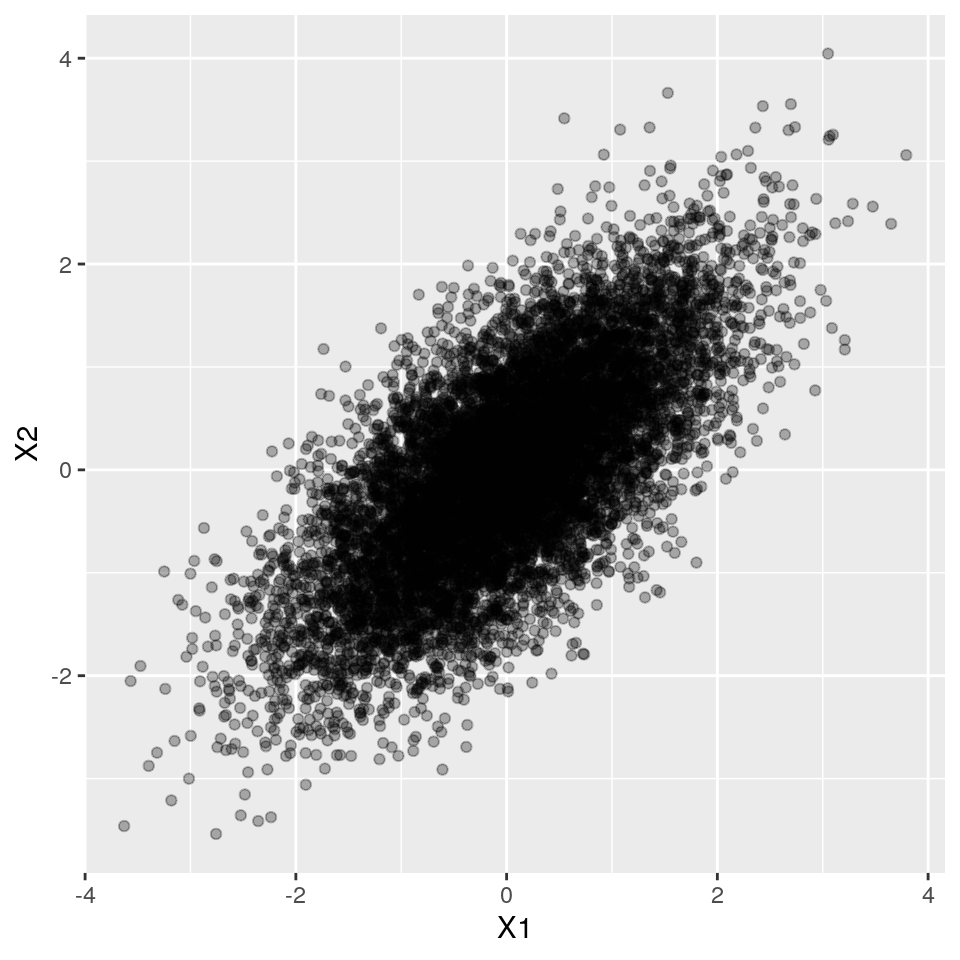
cor(df$X1, df$X2)## [1] 0.6985089Great!
Step 2: transform variables to uniform distribution
Using the normal cumulative distribution function pnorm(), we can transform our normally distributed variables to have a uniform distribution, while keeping the correlation structure intact!!!!
df$X1_U <- pnorm(df$X1)
df$X2_U <- pnorm(df$X2)

ggplot(df, aes(x = X1_U)) + geom_histogram(boundary = 0)
## `stat_bin()` using `bins = 30`. Pick better value with `binwidth`.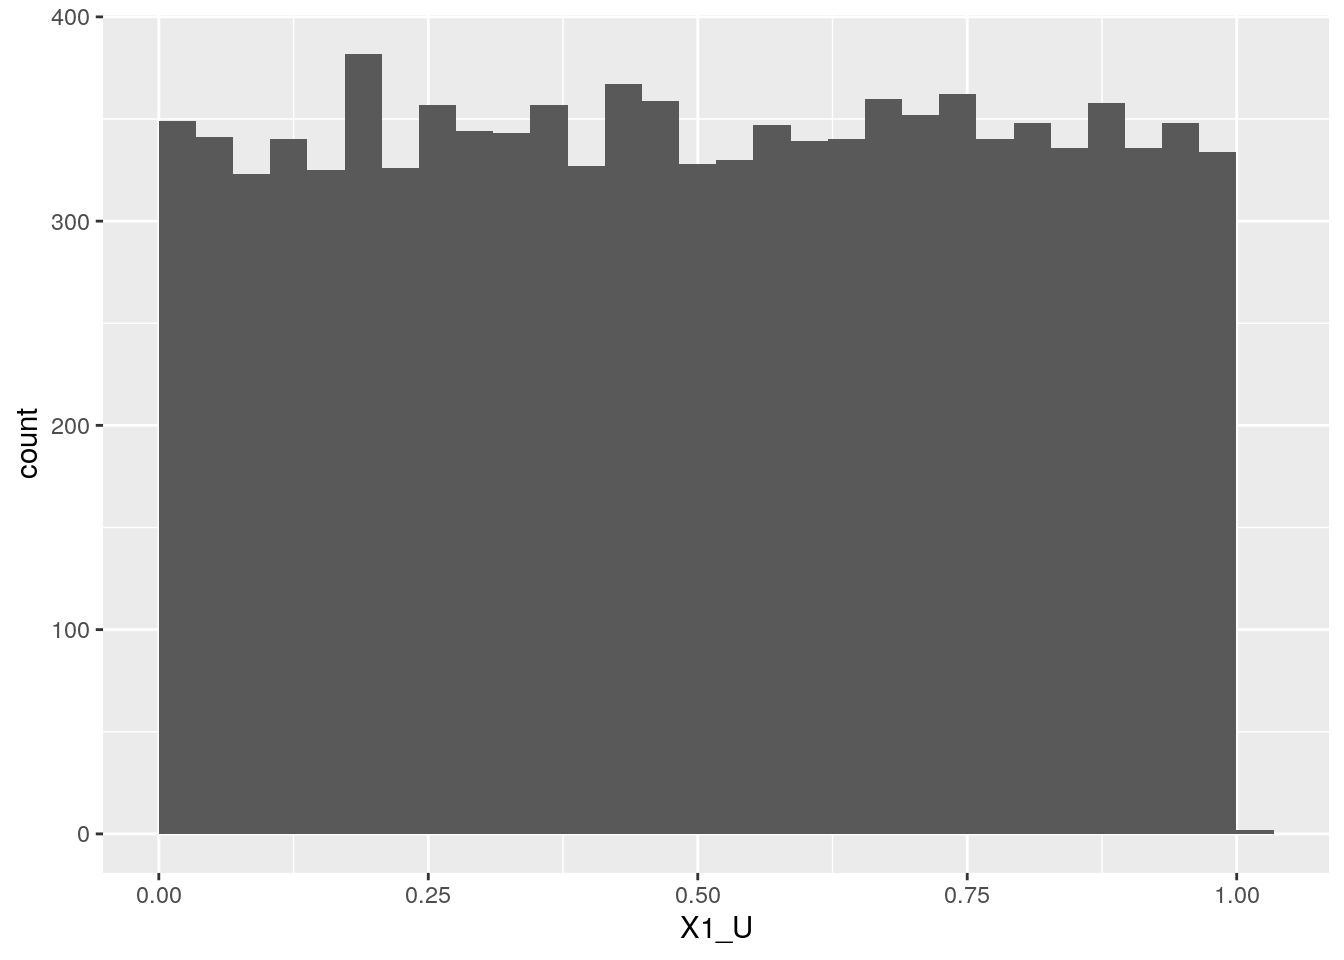
ggplot(df, aes(x = X1_U, y = X2_U)) +
  geom_point(alpha = 0.3)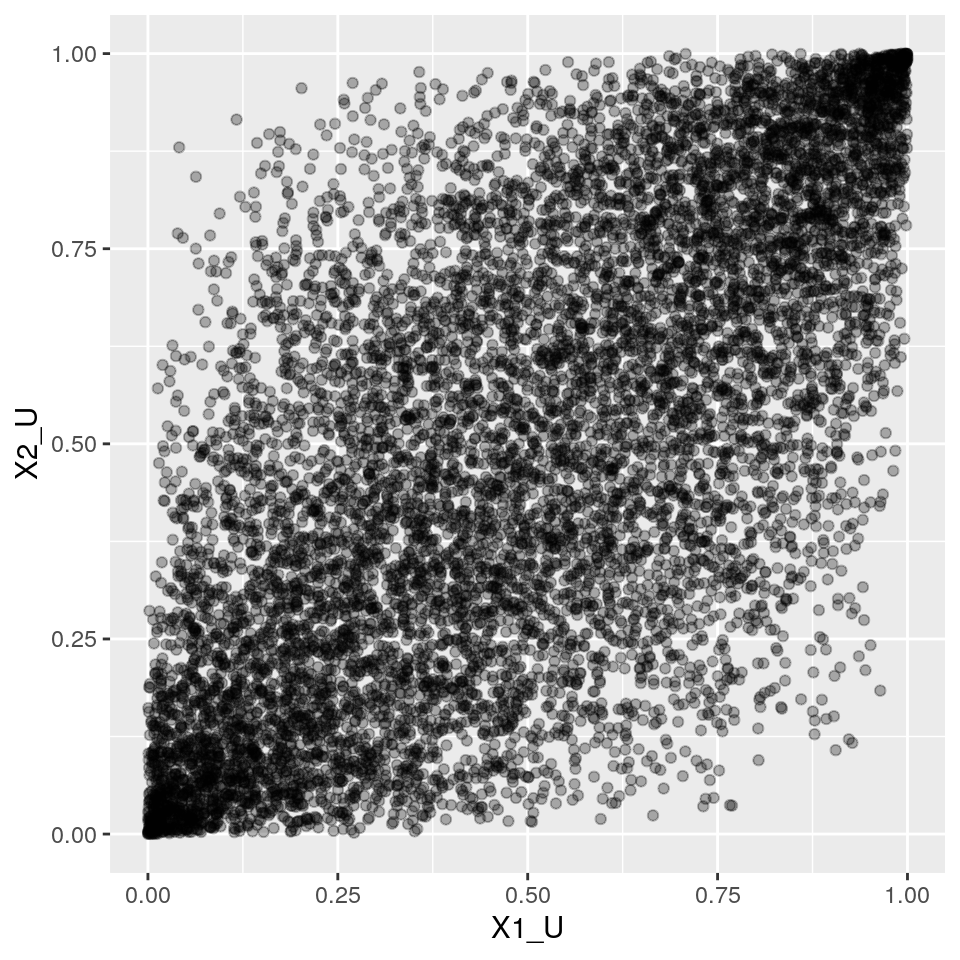
And here's our copula! Two variables, each marginally (by itself) uniform, but with pre-specified correlation intact!
cor(df$X1_U, df$X2_U)## [1] 0.677868Step 3: from uniform to any standard probability distribution we like
Now, if we plug in uniformly distributed data in a quantile function of any arbitrary (known) probability distribution, we can make the variables have any distribution we like.
Let's pick for example a Gamma distribution (Continuous, positive) with shape 4 and rate 1 for X1, and Let's pick a Normal distribution (Continuous, symmetric) with mean 10 and sd 2 for X2.
df$X1_GAM <- qgamma(df$X1_U, shape = 4, rate =1)
df$X2_NORM <- qnorm(df$X2_U, mean = 10, sd = 2)
ggplot(df, aes(x = X1_GAM)) +
geom_histogram(boundary = 0) +
geom_vline(xintercept = 4, col = "red")## `stat_bin()` using `bins = 30`. Pick better value with `binwidth`.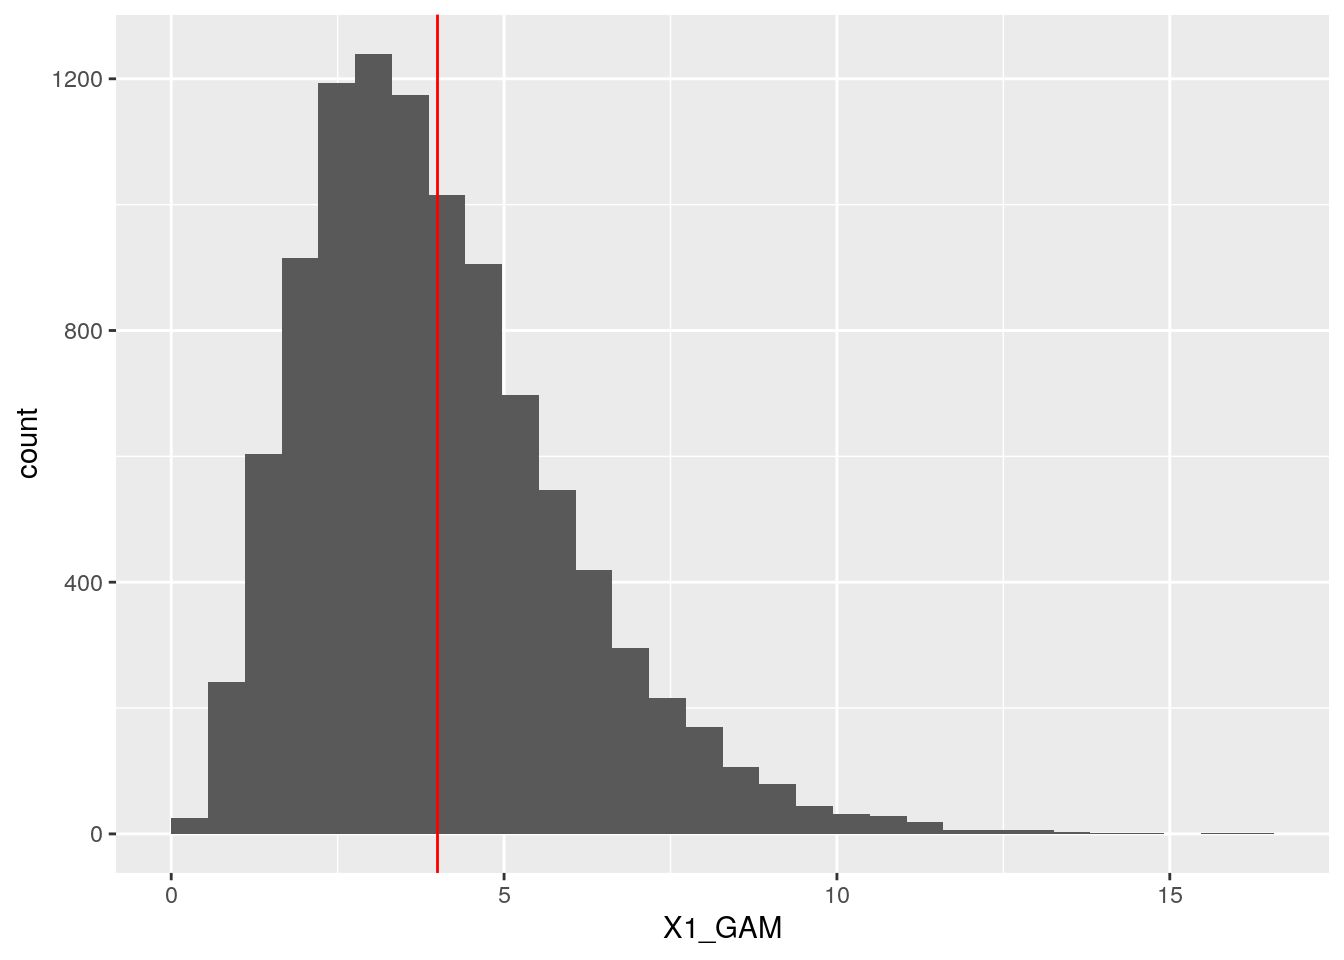
ggplot(df, aes(x = X2_NORM)) +
  geom_histogram(boundary = 0) +
  geom_vline(xintercept = 10, col = "red")
## `stat_bin()` using `bins = 30`. Pick better value with `binwidth`.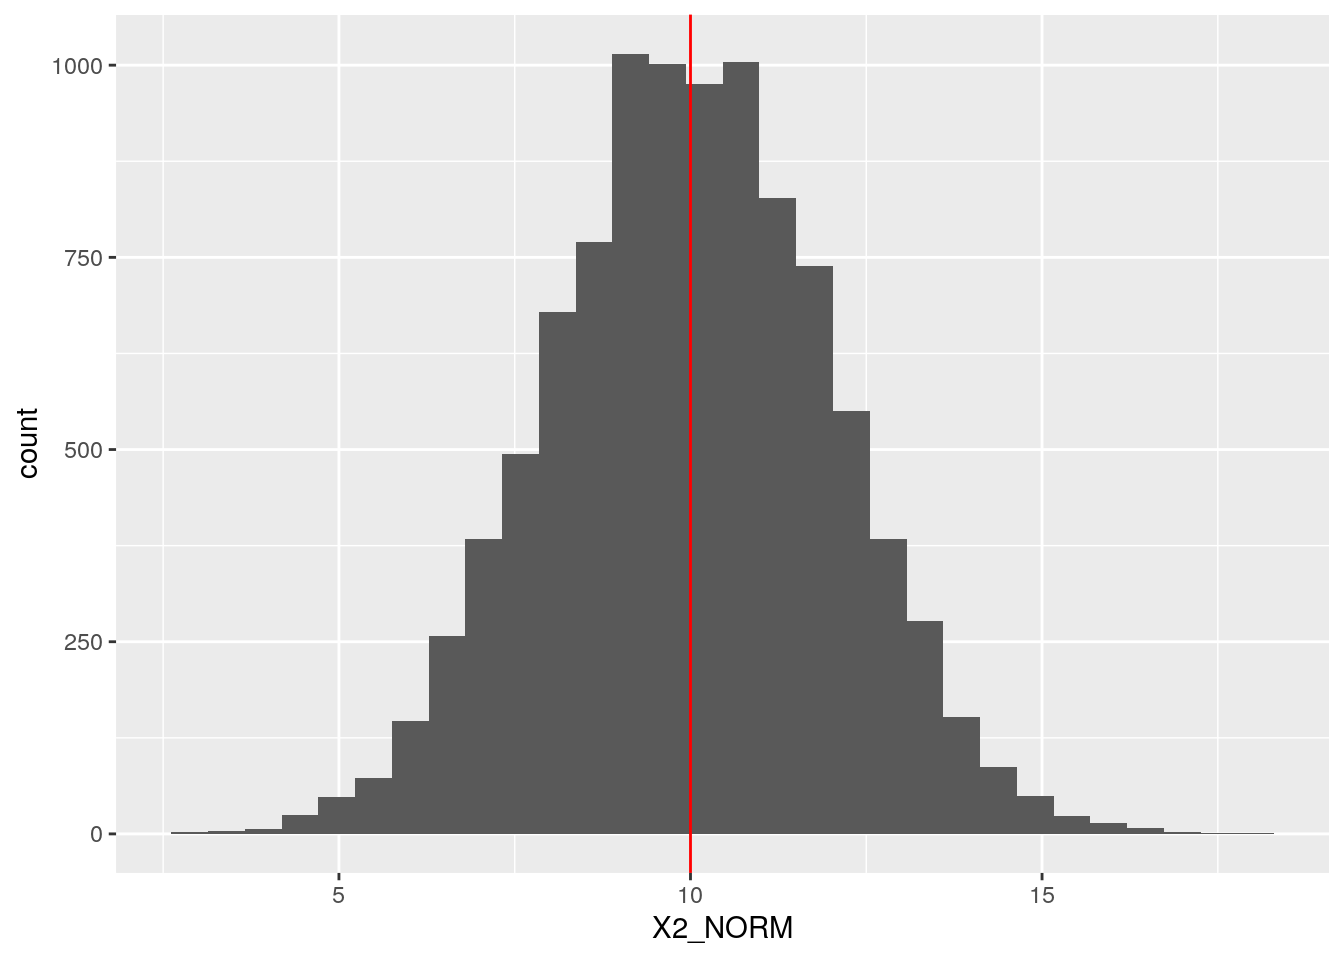
Ok, that worked nicely. But what about their correlation?
cor(df$X1_GAM, df$X2_NORM)## [1] 0.682233Whoa!! They still have (almost) the same correlation we started out with before all our transformation magic.
Simstudy in action
Now let's see how simstudy helps us generating this type of simulated data. Simstudy works with "definition tables" that allow us to specify, for each variable, which distribution and parameters to use, as well as the desired correlations between the variables.
After specifing a definition table, we can call one of its workhorse functions genCorFlex() to generate the data.
N.b. Simstudy uses different parameters for the Gamma distribution, compared to R's rgamma() function. Under water, it uses the gammaGetShapeRate() to transform the "mean" and "variance/ dispersion" to the more conventional "shape" and "rate" parameters.
set.seed(123)

corr <- 0.7

corr.mat <- matrix(c(1, corr,
                  corr, 1), nrow = 2)

# check that gamma parameters correspond to same shape and rate pars as used above
#simstudy::gammaGetShapeRate(mean = 4, dispersion = 0.25)


def <- defData(varname = "X1_GAM",
               formula = 4, variance = 0.25, dist = "gamma")

def <- defData(def, varname = "X2_NORM",
               formula = 10, variance = 2, dist = "normal")


dt <- genCorFlex(1e4, def, corMatrix = corr.mat)

cor(dt[,-"id"])
## X1_GAM X2_NORM
## X1_GAM 1.0000000 0.6823006
## X2_NORM 0.6823006 1.0000000ggplot(dt, aes(x = X1_GAM)) +
geom_histogram(boundary = 0) +
geom_vline(xintercept = 4, col = "red")## `stat_bin()` using `bins = 30`. Pick better value with `binwidth`.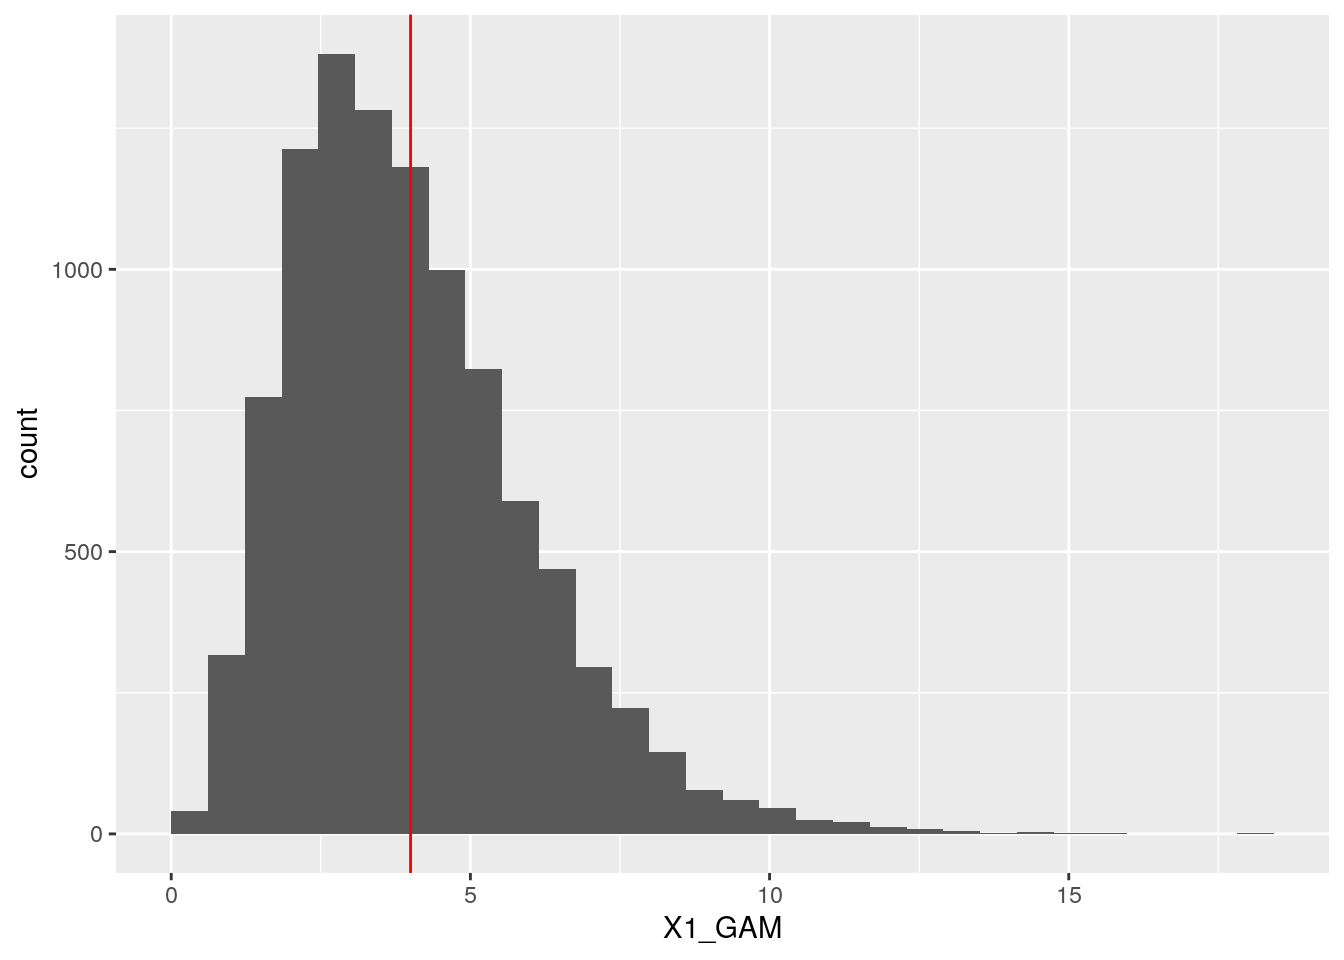
Generate correlated binary variables
As it turns out, the copula approach does not work for binary variables. Well, it sort of works, but the correlations we get are lower than we actually specify.
Come to think of it: two binary variables cannot have all the correlations we like. To see why, check this out.
Feasible correlations for two binary variables
Let's suppose we have a binary variable that equals 1 with probability 0.2, and zero otherwise. This variable will never be fully correlated with a binary variable that equals 1 with probability 0.8, and zero otherwise.
To see this, I created two binary vectors that have a fraction 0.2 and 0.8 of 1's, and let's see if we can arrange the values in both vectors in such a way that minimizes and maximizes their correlation:
# maximal correlation
x1 <- c(0, 0, 0, 0, 1)
x2 <- c(0, 1, 1, 1, 1)

mean(x1)
## [1] 0.2mean(x2)## [1] 0.8cor(x1, x2)## [1] 0.25# minimal correlation
x1 <- c(1, 0, 0, 0, 0)
x2 <- c(0, 1, 1, 1, 1)
cor(x1, x2)## [1] -1To get these vectors to be maximally correlated, we need to match 1's in x1 as much as possible with 1s in x2. To get these vectors to be maximally anti-correlated, we need to match 1s in x1 with as many 0s in x2.
In this example, we conclude that the feasible correlation range is {-1, 0.25}.
The simstudy package contains a function to check for feasible boundaries, that contains this piece of code:
p1 <- 0.2
p2 <- 0.8

# lowest correlation
l <- (p1 * p2)/((1 - p1) * (1 - p2))

max(-sqrt(l), -sqrt(1/l))
## [1] -1# highest correlation
u <- (p1 * (1 - p2))/(p2 * (1 - p1))
min(sqrt(u), sqrt(1/u))## [1] 0.25This confirms our example above.
Note that if we want to mimic a real dataset with binary correlated variables, the correlations are a given, and are obviously all feasible because we obtain them from actual data.
A model for two correlated binary variables
Ok let's suppose we want a two binary vectors B1 and B2 , with means p1 = 0.2 and p2 = 0.8 and (feasible) Pearson correlation 0.1.
How? How?
The idea is that to get two binary variables to have an exact particular correlation, we imagine an underlying ("latent") bivariate (2D) normal distribution. This normal distribution has the means fixed to 0, and the standard deviations fixed to 1.
Why? Because a) we know it very well theoretically and b) we know how to simulate efficiently from such a distribution, using mvrnorm().
In this bivariate normal distribution, we draw a quadrant (i.e. two thresholds). The thresholds define transformations to binary variables. Below the threshold, the binary value is 0, above it is 1. We have to pick the thresholds such that the resulting binary variables have the desired mean (i.e. percentage of 1's).
This approach reduces the problem to finding the right values of three parameters: multivariate normal correlation, and the two thresholds (above, we already fixed the means and variance to zero and one respectively).
For now, we'll just pick some value for the correlation in the bivariate normal, say 0.5, and focus on where to put the threshholds.
set.seed(123)

corr <- 0.5

cov.mat <- matrix(c(1, corr,
                  corr, 1), nrow = 2)

df <- data.frame(MASS::mvrnorm(n = 10000,
                               mu = c(0, 0),
                               Sigma = cov.mat))
(The diagonal of 1 makes sure the variables have SD of 1. The off diagonal value of 0.7 gives us a Pearson correlation of 0.7)
ggplot(df, aes(x = X1, y = X2)) +
  geom_point(alpha = 0.3)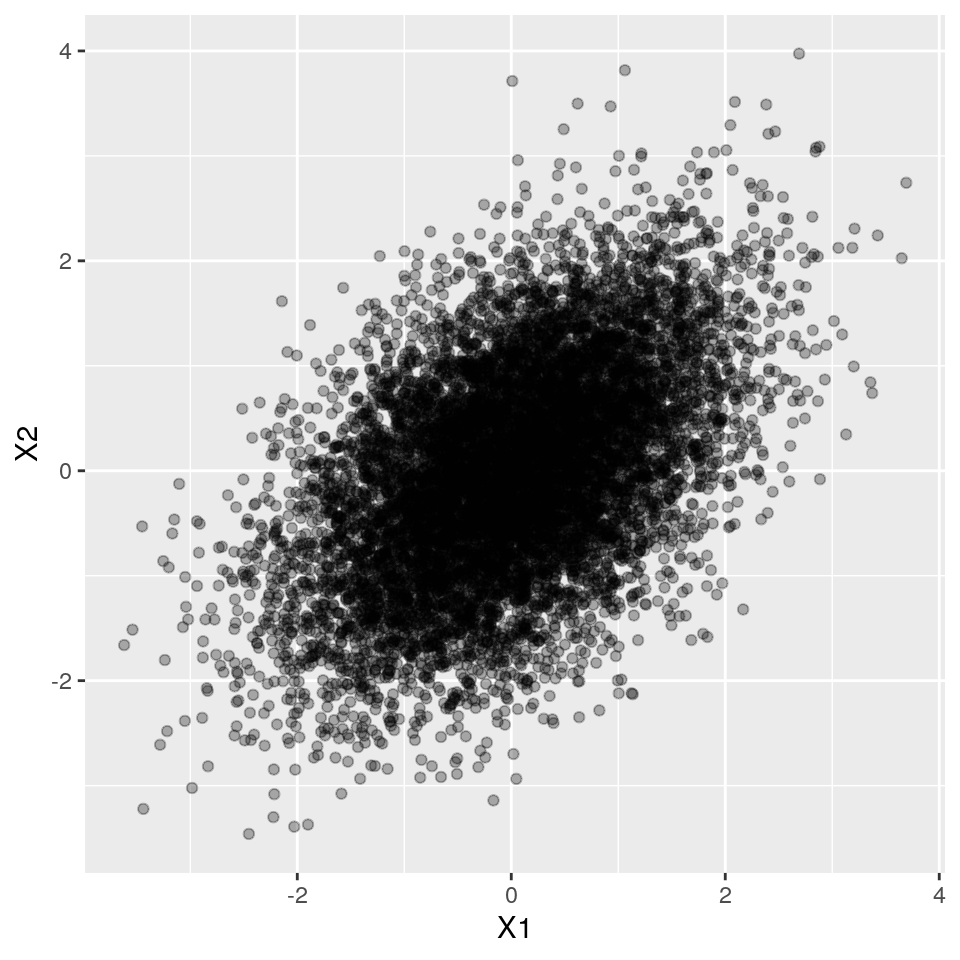
Ok, where to put the thresholds? That's simple, we just need to use the quantile distribution function to partition the marginal normal variables into 0 and 1 portions.
df$B1 <- ifelse(df$X1 < qnorm(0.2), 1, 0)
df$B2 <- ifelse(df$X2 < qnorm(0.8), 1, 0)

mean(df$B1)
## [1] 0.197mean(df$B2)## [1] 0.7988Let's check it out visually:
ggplot(df, aes(x = X1, y = X2)) +
  geom_point(alpha = 0.3) +
  geom_vline(xintercept = qnorm(0.2), col = "red") +
  geom_hline(yintercept = qnorm(0.8), col = "red")
Nice.
Ok, so now what is the correlation for these two binary variables?
cor(df$B1, df$B2)## [1] 0.1877482Ok, so if X1 and X2 have a correlation of 0.5, this results in a correlation of 0.19 between the binary variables B1 and B2.
But we need B1 and B2 to have a correlation of 0.1!
At this point, there is only one free parameter left, the correlation of the normally distributed variables X1 and X2.
We could of course manually try to find which correlation we must choose between X1 and X2 to get the desired correlation of 0.1 in the binary variables. But that would be very unpractical.
Fortunately, Emrich and Piedmonte (1991) published an iterative method to solve this puzzle. And this method has been implemented in simstudy.
simstudy:::.findRhoBin(p1 = 0.2,
                       p2 = 0.8, d = 0.1)
## [1] 0.2218018Let's see if it works:
set.seed(1234)

corr <- 0.2218018

cov.mat <- matrix(c(1, corr,
                  corr, 1), nrow = 2)

df <- data.frame(MASS::mvrnorm(n = 1e6,
                               mu = c(0, 0),
                               Sigma = cov.mat))

df$B1 <- ifelse(df$X1 < qnorm(0.2), 1, 0)
df$B2 <- ifelse(df$X2 < qnorm(0.8), 1, 0)

cor(df$B1, df$B2)
## [1] 0.09957392Great!
Relation to psychometrics
So what has psychometrics to do with all this simulation of correlated binary vector stuff?
Well, psychometrics is all about theorizing about unobserved, latent, imaginary "constructs", such as attitude, general intelligence or a personality trait. To measure these constructs, questionnaires are used. The questions are called items.
Now imagine a situation where we are interested in a particular construct, say general intelligence, and we design two questions to measure (hope to learn more about) the construct. Furthermore, assume that one question is more difficult than the other question. The answers to both questions can either be wrong or right.
We can model this by assuming that the (imaginary) variable "intelligence" of each respondent is located on a two-dimensional plane, with the distribution of the respondents determined by a bivariate normal distribution. Dividing this plane into four quadrants then gives us the measurable answers (right or wrong) to both questions. Learning the answers to both questions then gives us an approximate location of a respondent on our "intelligence" plane!
Phi, tetrachoric correlation and the psych package
Officially, the Pearson correlation between two binary vectors is called the Phi coefficient. This name was actually chosen by Karl Pearson himself.
The psych packages contains a set of convenient functions for calculating Phi coefficients from empirical two by two tables (of two binary vectors), and finding the corresponding Pearson coefficient for the 2d (latent) normal. This coefficient is called the tetrachoric correlation. Again a fine archaic slang word for again a basic concept.
library(psych)##
## Attaching package: 'psych'## The following objects are masked from 'package:ggplot2':
##
## %+%, alpha# convert simulated binary vectors B1 and B2 to 2x2 table
twobytwo <- table(df$B1, df$B2)/nrow(df)
phi(twobytwo, digits = 6)## [1] 0.099574cor(df$B1, df$B2)## [1] 0.09957392# both give the same resultWe can use phi2tetra to find the tetrachoric correlation that corresponds to the combination of a "Phi coefficient", i.e. the correlation between the two binary vectors, as well as their marginals. This is a wrapper that builds the two by two frequency table and then calls tetrachoric() . This in turn uses optimize (Maximum Likelihood method?) to find the tetrachoric correlation.
phi2tetra(0.1, c(0.2, 0.8))## [1] 0.2217801# compare with EP method
simstudy:::.findRhoBin(0.2, 0.8, 0.1)## [1] 0.2218018Comparing with the Emrich and Piedmonte method, we find that they give identical answers. Great, case closed!
Simstudy in action II
Now that we feel confident in our methods and assumptions, let's see simstudy in action.
Let's generate two binary variables, that have marginals of 20% and 80% respectively, and a Pearson correlation coefficient of 0.1.
set.seed(123)
corr <- 0.1

corr.mat <- matrix(c(1, corr,
                  corr, 1), nrow = 2)

res <- simstudy::genCorGen(10000, nvars = 2,
                 params1 = c(0.2, 0.8),
                 corMatrix = corr.mat,
                 dist = "binary",
                 method = "ep", wide = TRUE)

# let's check the result
cor(res[, -c("id")])
## V1 V2
## V1 1.00000000 0.09682531
## V2 0.09682531 1.00000000Awesome, it worked!
Conclusion
Recall, my motivation for simulating fake data with particular variable types and correlation structure is to mimic real datasets.
So are we there yet? Well, we made some progress. We now can handle correlated continuous data, as well as correlated binary data.
But we need to solve two more problems:
To simulate a particular dataset, we still need to determine for each variable its data type (binary or continuous), and if it's continuous, what is the most appropriate probability distribution (Normal, Gamma, Log-normal, etc).
we haven't properly solved correlation between dissimilar data types, e.g. a correlation between a continuous and a binary variable.
Judging from the literature (Amatya & Demirtas 2016) and packages such as SimMultiCorrData by Allison Fialkowski, these are both solved, and I only need to learn about them! So, to be continued.
Gertjan Verhoeven
Data Scientist / Policy Advisor
Gertjan Verhoeven is a research scientist currently at the Dutch Healthcare Authority, working on health policy and statistical methods. Follow me on Twitter or Mastodon to receive updates on new blog posts. Statistics posts using R are featured on R-Bloggers.