Arduino Weather Station with datalogging
In this post, I show how to create a Arduino-based atmospheric sensor circuit capable of storing large amounts of data on a microSD card.
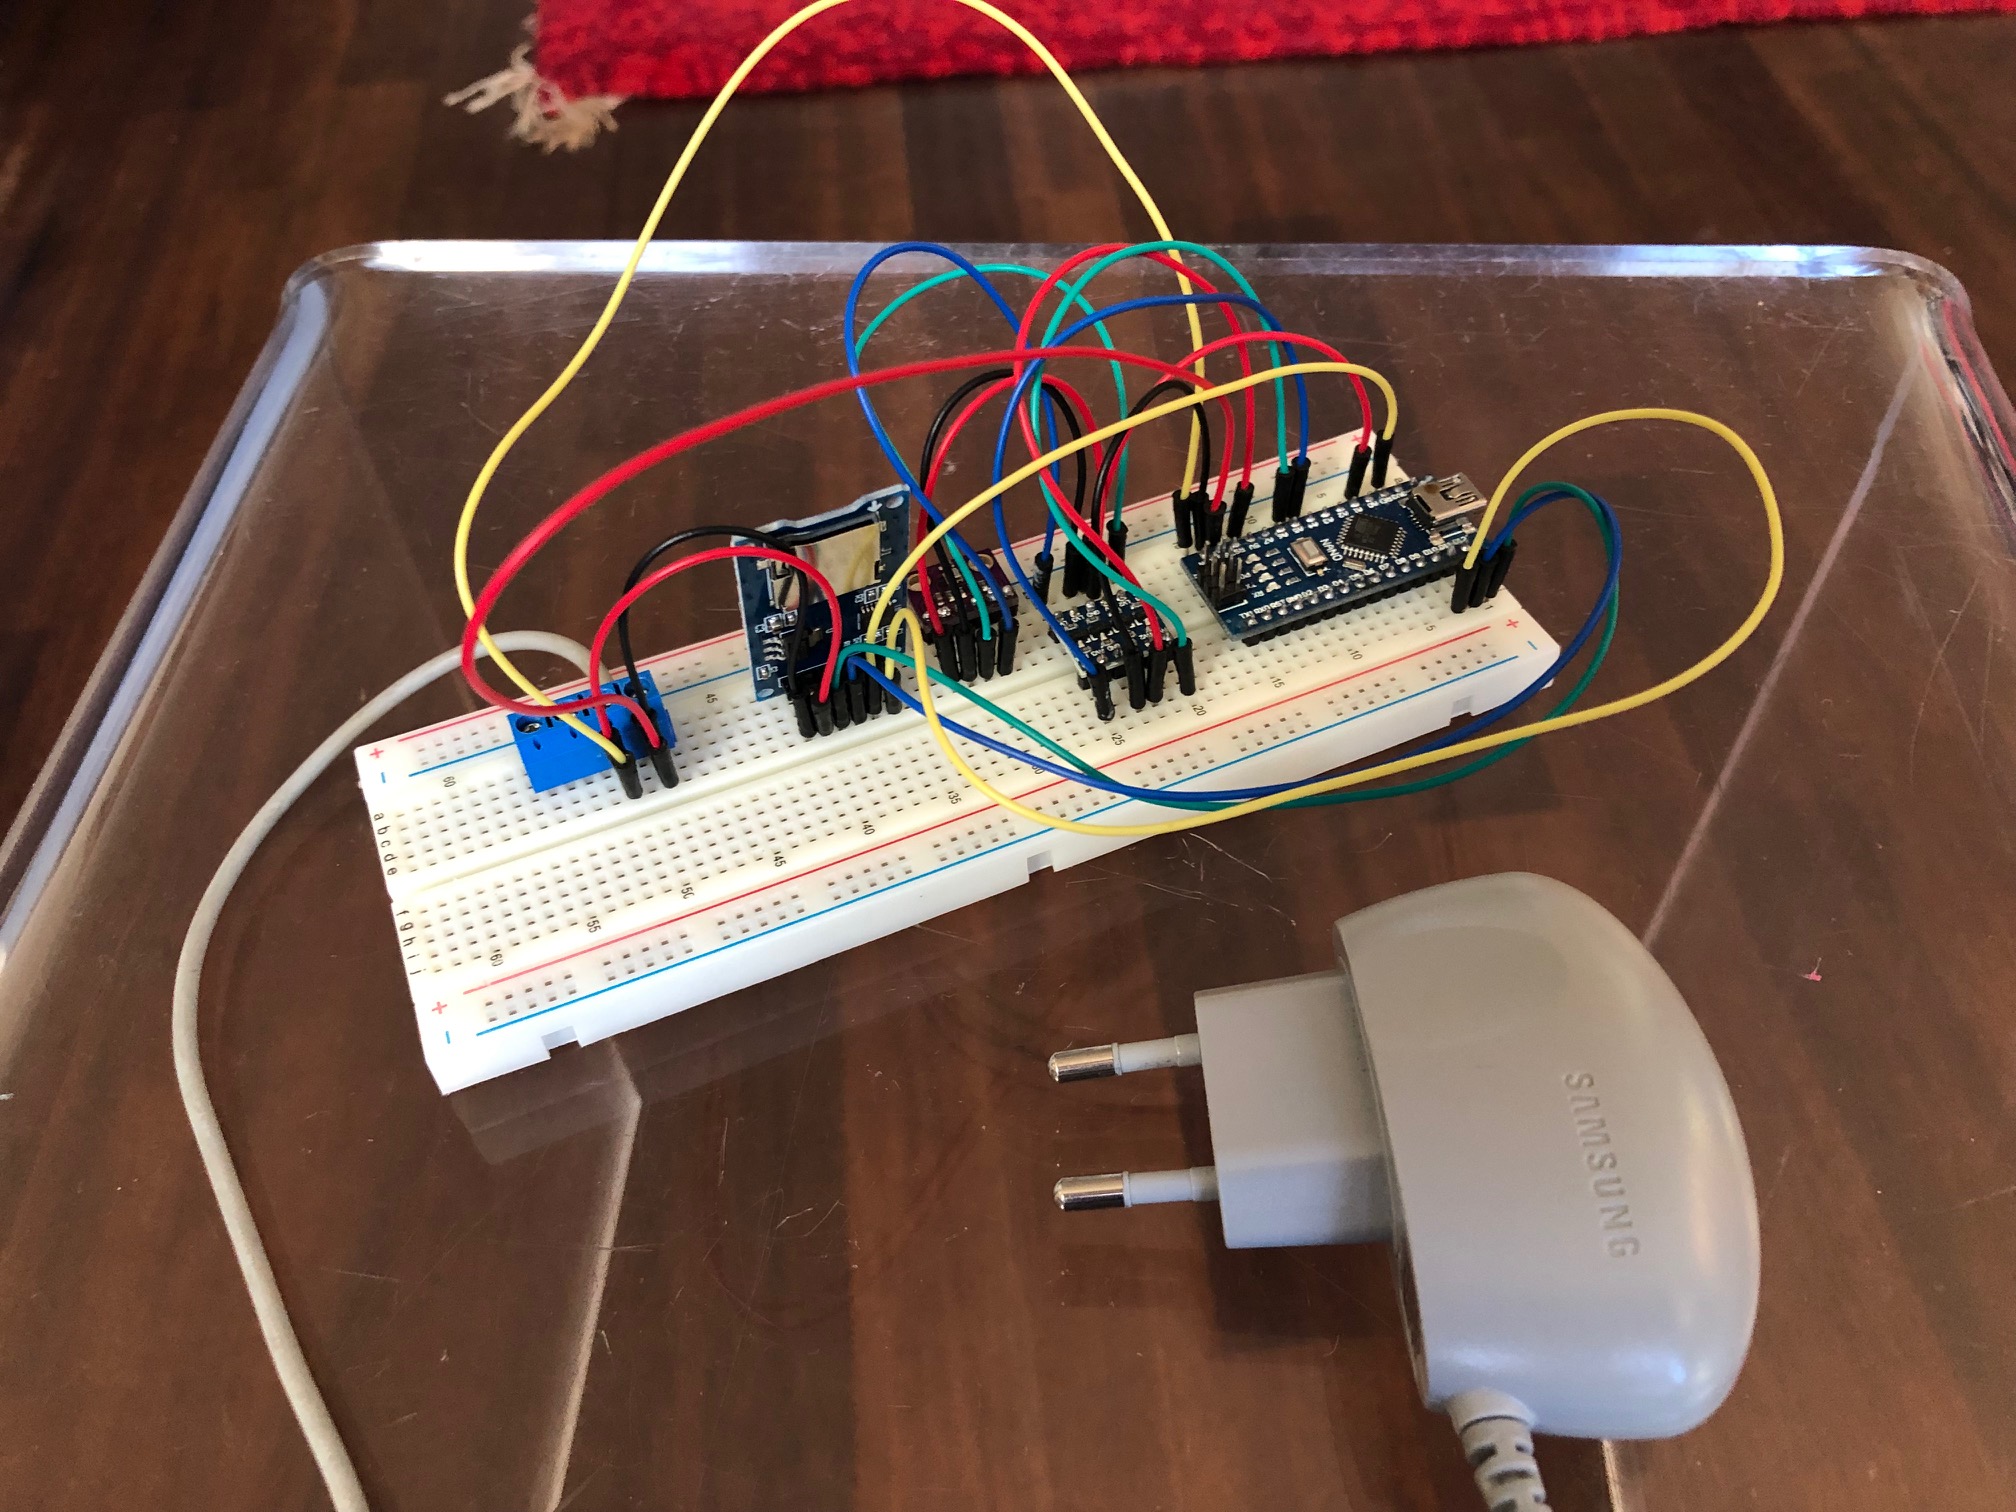
Nowadays, one can buy a commercial Thermo/Hygro datalogger for 50 Euro online (i.e. https://www.vitalitools.nl/lascar-electronics-el-usb-2-datalogger). However, I decided that it would be a nice project to learn more about Arduino, in particular how to interface it with a microSD card. So i made one myself. Working with SD cards has the advantage of having a huge storage capacity. To give you an impression: Below we analyse 10K measurements stored in a 60 Kb file, the SD card can hold 4 Gb!
Components
After some research I ordered:
- A microSD card reader/writer with SPI interface (Catalex card)
- A Bosch BME-280 temperature/pressure/humidity sensor with I2C interface
As the BME-280 sensor operates at 3.3V and my Arduino Nano at 5V, I also ordered a four channel Logic Level Converter to convert the 5V I2C on the Arduino side of the LLC to 3.3V on the BME-280 side.
To make the circuit Mains powered, i took an old Samsung mobile phone Charger (5V 0.7A), cutoff the plug and attached it to the breadboard.
Circuit & Programming
The breadboard layout (created using Fritzing) is shown below:
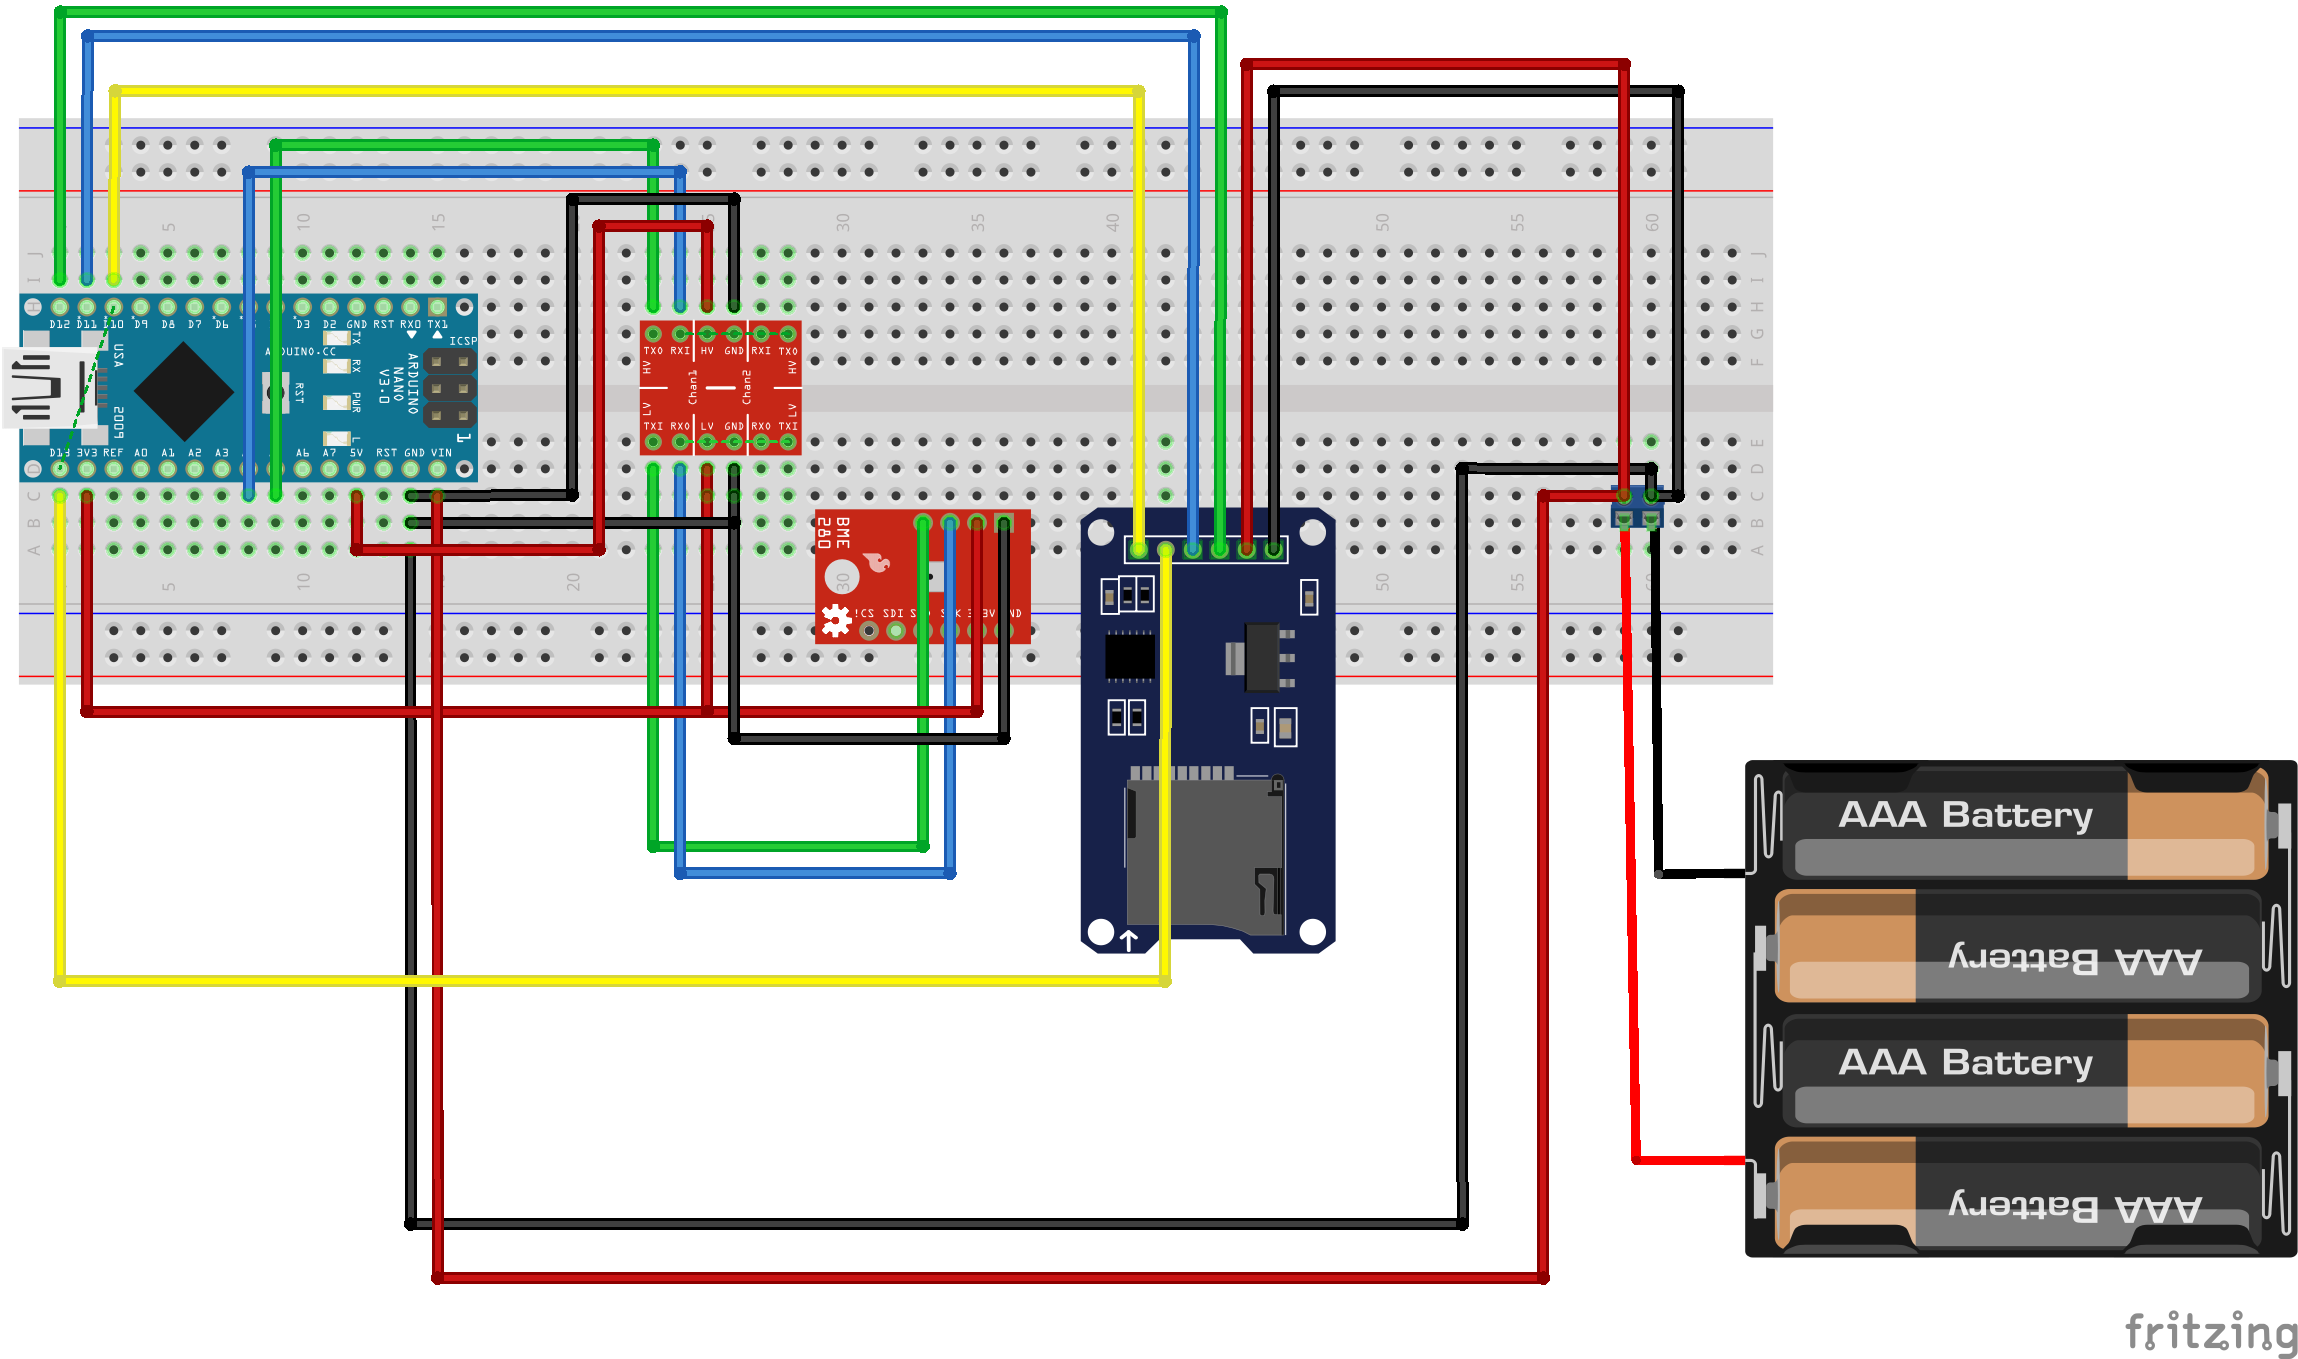
At first i was using the Arduino 5V pin (with Arduino connected to USB at the front of my Desktop PC, these USB ports might have lower current) to power both the SD card and the Level converter. Separately they would work fine, but together in one circuit the SD card gave erratic results. I guessed that current consumption was too high, and during testing I used the 5V charger as power supply for the SD card. During actual usage I used the 5V charger to power both the SD card AND the Arduino Nano, which worked nicely.
Coding was simple, i just combined the example code and libraries for a SPI SD card and for a BME-280 I2C sensor. I put the code on GitHub anyway as a reference.
Data collection and preparation
I ended up testing the device by letting it collect measurements in four different places within the house. In the following order:
- The living room
- The basement
- First floor bedroom
- First floor bathroom
After collecting the data I put the microSD card in a microSD card reader and copied the DATALOG.TXT CSV file to my pc for analysis in R.
df <- read.csv2("DATALOG.TXT", header = F)
colnames(df) <- c("Time", "Temp", "Hum", "Pressure")
# give the four traces a unique ID
df$start_trace <- ifelse(df$Time == 0, 1, 0)
df$trace_id <- cumsum(df$start_trace)

mdf <- melt(df, id.vars = c("Time", "trace_id"))
## Warning in melt(df, id.vars = c("Time", "trace_id")): The melt generic in
## data.table has been passed a data.frame and will attempt to redirect to the
## relevant reshape2 method; please note that reshape2 is deprecated, and this
## redirection is now deprecated as well. To continue using melt methods from
## reshape2 while both libraries are attached, e.g. melt.list, you can prepend the
## namespace like reshape2::melt(df). In the next version, this warning will become
## an error.## Warning: attributes are not identical across measure variables; they will be
## dropped# label the four traces
trace_id <- 1:4
trace_name <- c("Living room", "Basement",
"Bedroom 1st floor", "Bathroom 1st floor")
cod <- data.table(trace_id, trace_name =
factor(trace_name, levels = trace_name))
mdf <- data.table(merge(mdf, cod, by = "trace_id"))
mdf <- mdf[, value := as.numeric(value)]Analysis
Pressure
We start with the pressure measurements. This is supposed to be a proxy for altitude.
ggplot(mdf[mdf$variable == "Pressure" & Time > 1],
       aes(x = Time, y = value,
           color = variable, group = variable)) +
  geom_point(col = "grey") +
  facet_grid(~ trace_name) + geom_smooth(size = 1)
## `geom_smooth()` using method = 'loess' and formula 'y ~ x'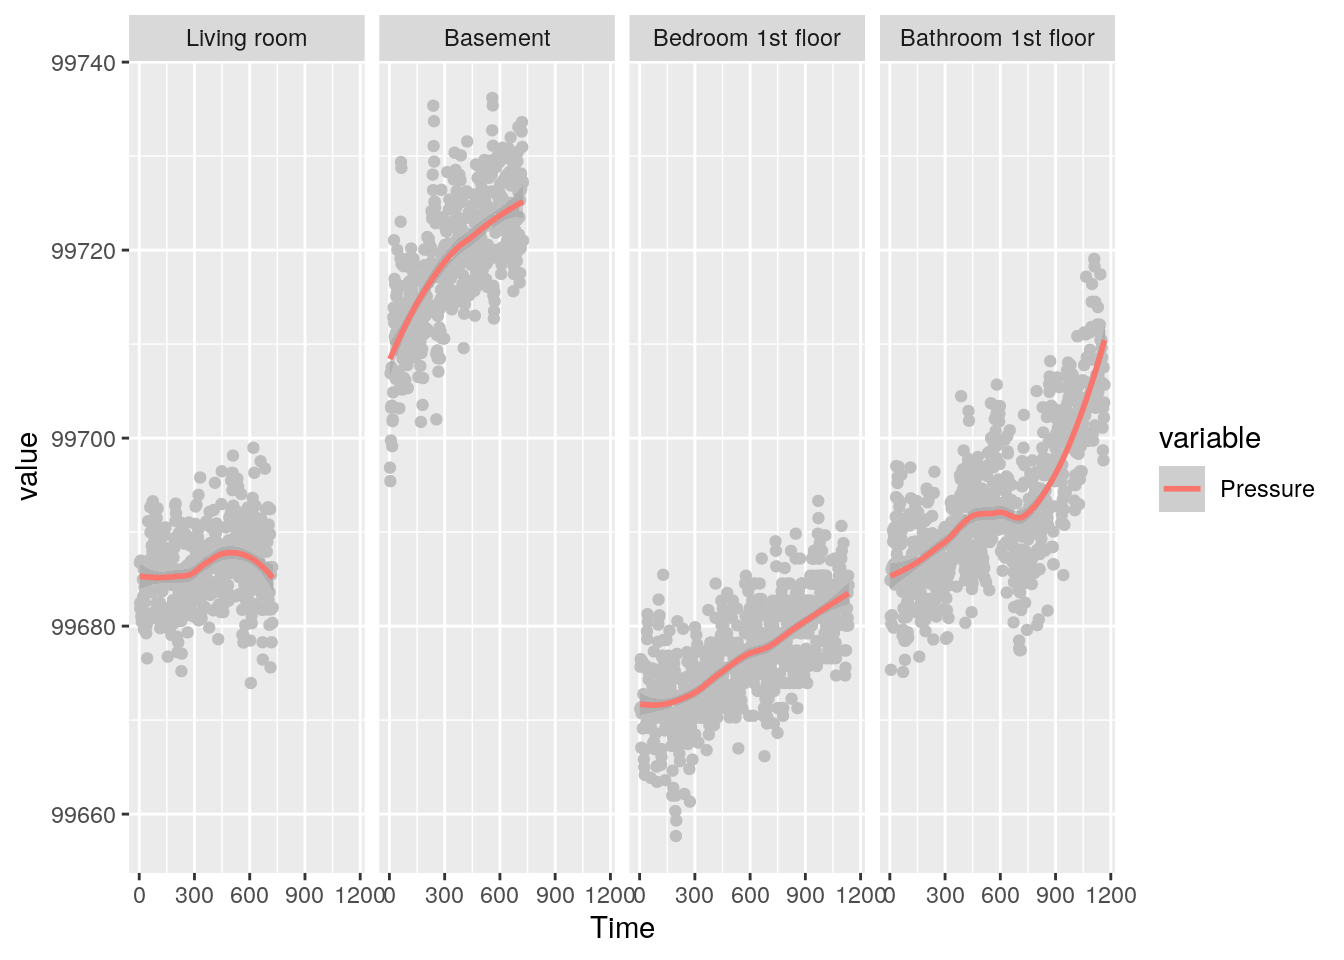
The basement, which is the lowest, has the highest pressure. But the difference between living room (ground floor) and the two rooms at the first floor is less pronounced. What is not so clear is what drives the changes in pressure WHILE the sensor is at a particular location, i.e. in the basement, or on the 1st floor. But no time to dwell on that, let's move on to the temperature!
Temperature
ggplot(mdf[mdf$variable == "Temp" & Time > 1],
       aes(x = Time, y = value,
           color = variable, group = variable)) +
  geom_point() + facet_grid(~ trace_name)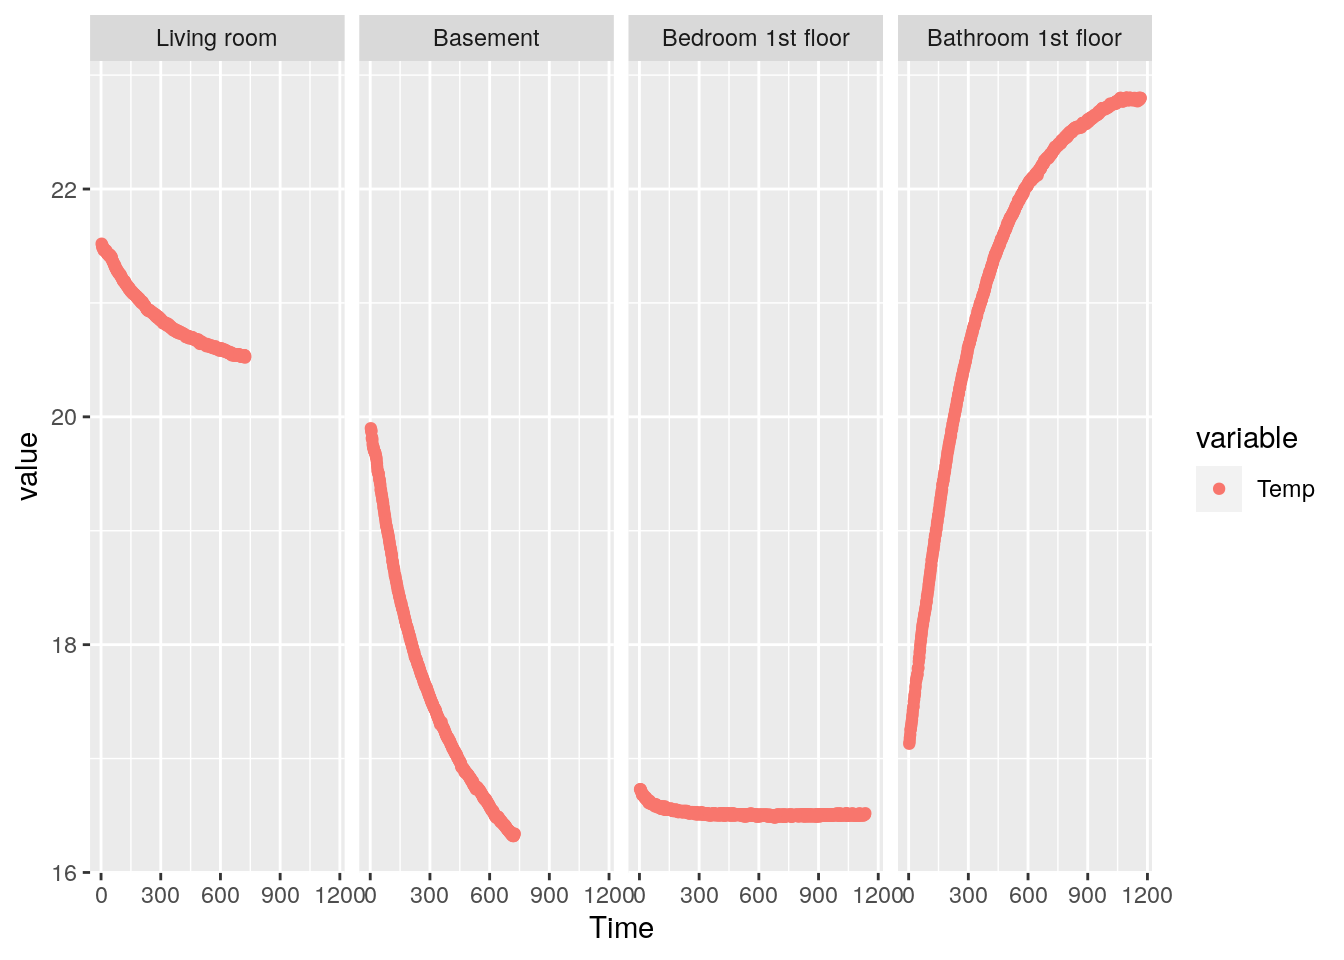
Here, it appears that the sequence of the rooms can explain the slowly changing patterns of temperature. We started out in the Living room at 21C (The thermostat was set at 20C at that time). Then towards the cold basement. It appears that temperature needed some time to equilibrate, possibly because the breadboard was placed on an elevated plastic box, insulating it from below. In the bedroom it was placed on the (cold) floor, and it was already cold from the basement. Then in the bathroom, the final location, it went up, probably due to the floor being heated to keep the bathroom at 18C.
Relative Humidity
Finally, the relative humidity. This appears super strongly correlated with the temperature.
ggplot(mdf[mdf$variable == "Hum" & Time > 1],
       aes(x = Time, y = value, color = variable,
           group = variable)) +
  geom_point() + facet_grid(~ trace_name)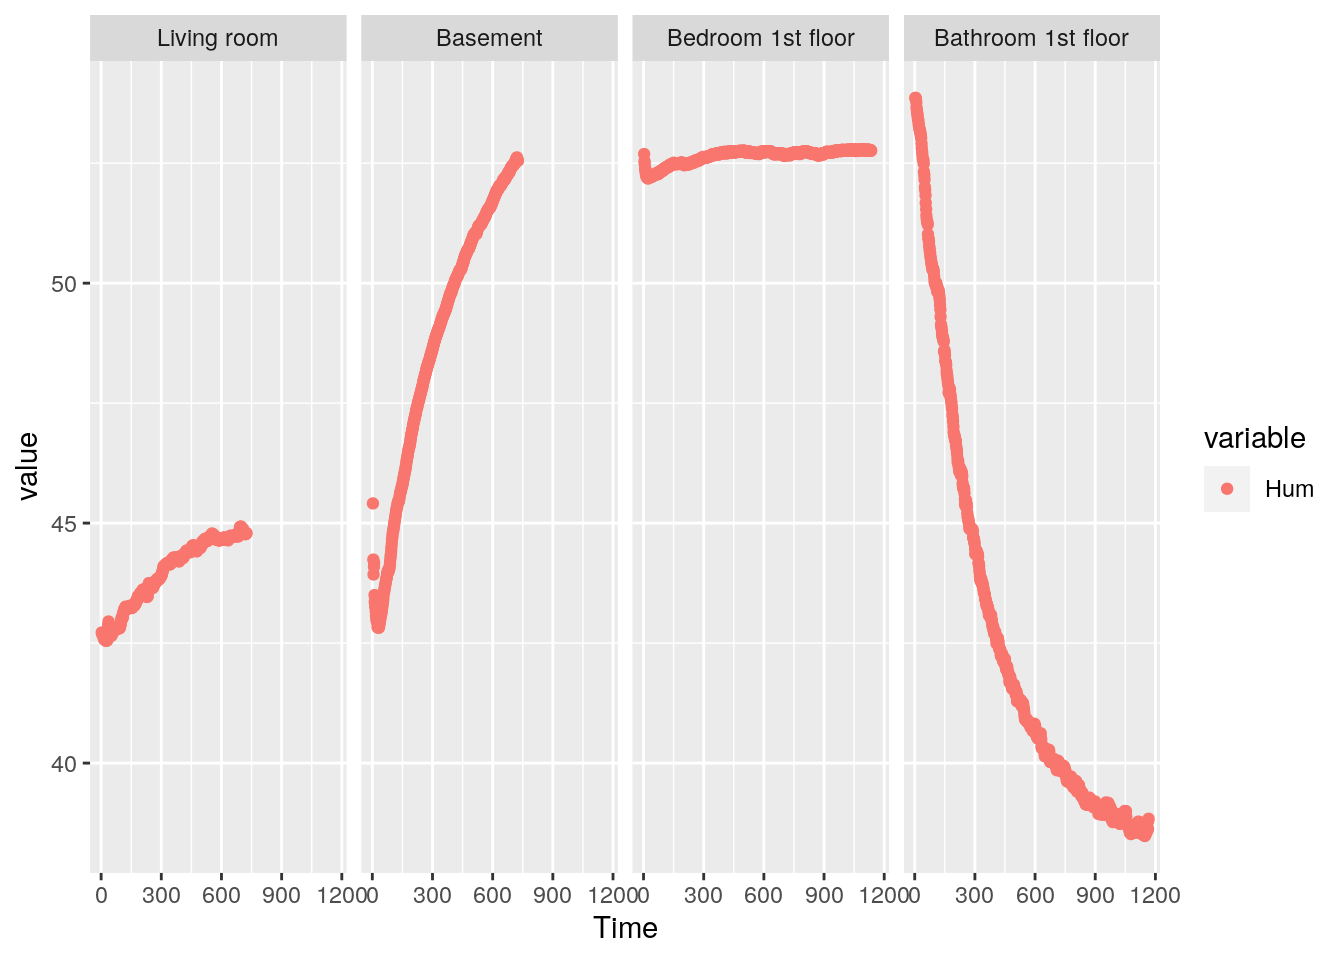
Here we see that the living room is at a agreeable 45% RH. The basement has a higher RH percentage, expected because it's colder.
According to Wikipedia:
Humans can be comfortable within a wide range of humidities depending on the temperature—from 30% to 70%[14]—but ideally between 50%[15] and 60%.[16] Very low humidity can create discomfort, respiratory problems, and aggravate allergies in some individuals.
The bedroom is also at a nice humidity level of 55% RH. The bathroom floor was being heated, and this unsurprisingly reduces the local RH to below 40%.
Conclusion
It all seems to work pretty well. Measurement quality appears reasonable, with temperature and humidity consistent and with little noise, whereas the pressure reading needs some averaging / smoothing to get a stable signal.
I had great fun making this device!
Gertjan Verhoeven
Data Scientist / Policy Advisor
Gertjan Verhoeven is a research scientist currently at the Dutch Healthcare Authority, working on health policy and statistical methods. Follow me on Twitter or Mastodon to receive updates on new blog posts. Statistics posts using R are featured on R-Bloggers.